Jul 24, 2025
Eurex
Focus on VSTOXX® Derivatives | June 2025 recap
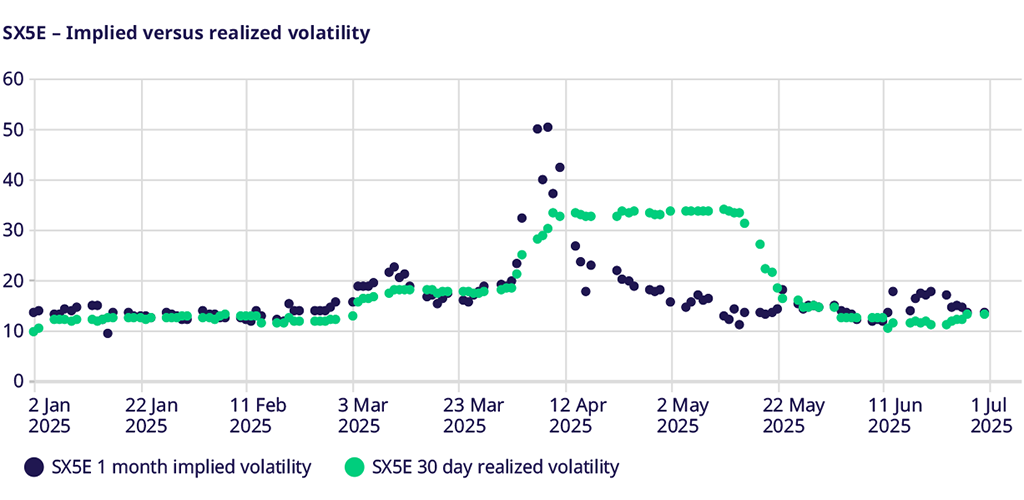
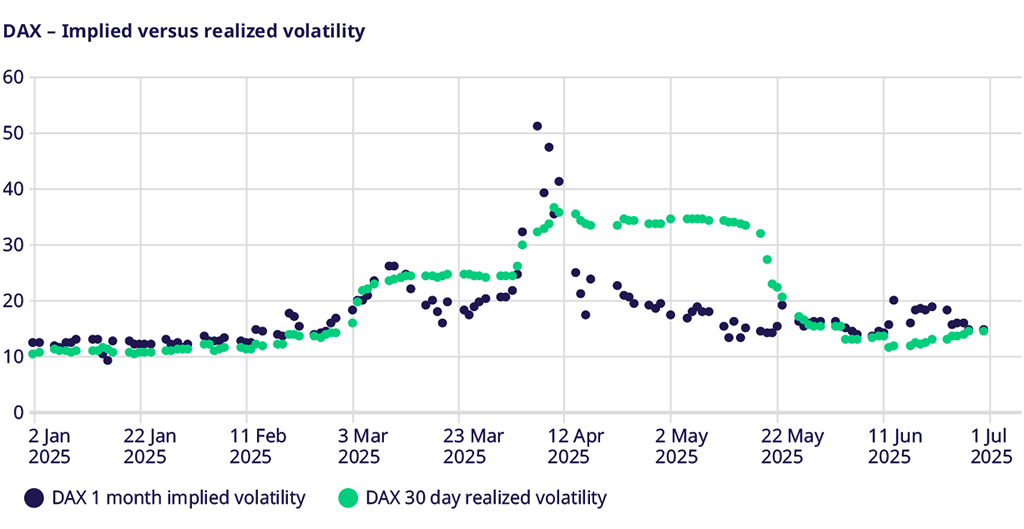
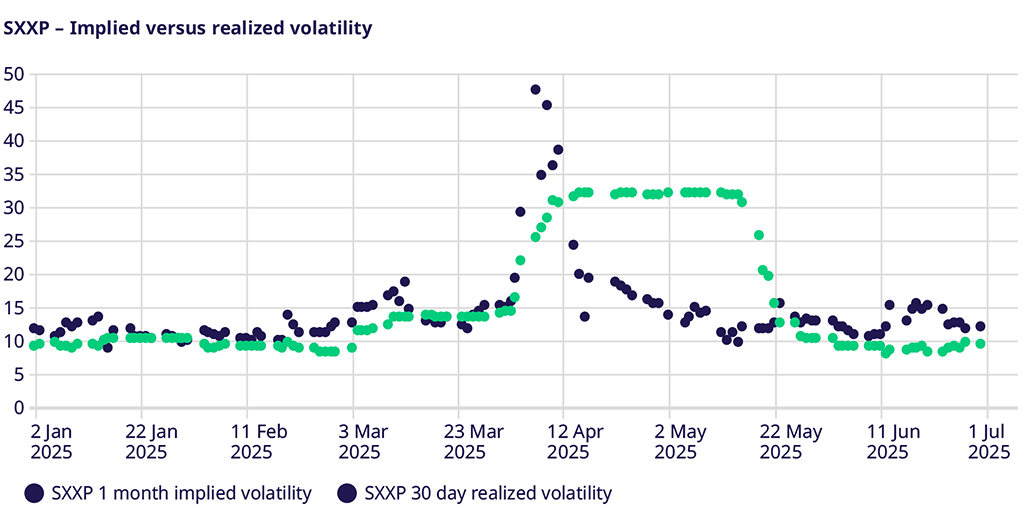
European markets lagged behind their global peers in June, with EURO STOXX 50® declining by 1.1%, STOXX® 600 dropping by 1.19%, and the DAX Index performing slightly better but still down 0.4%
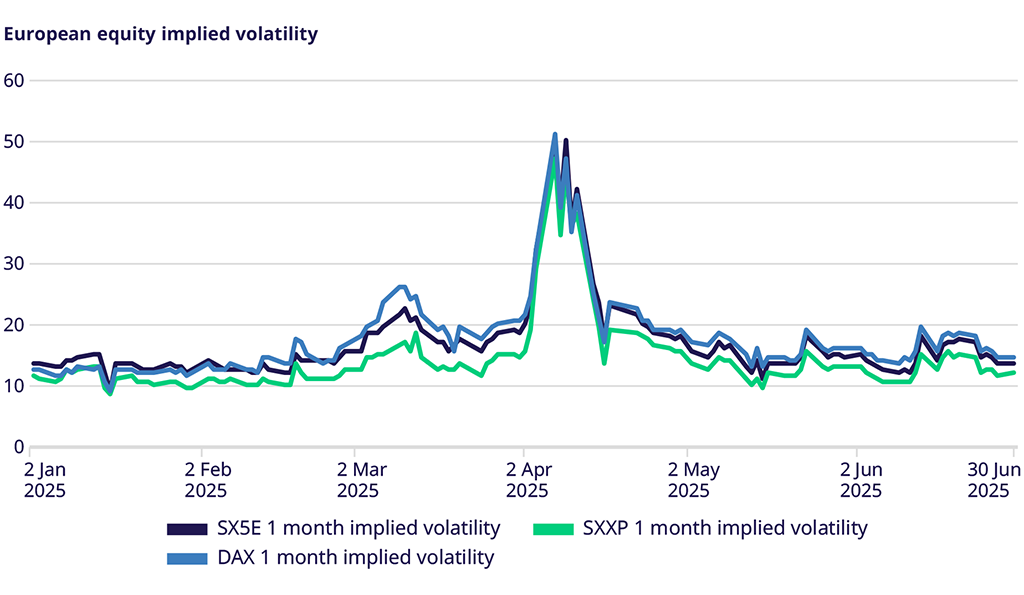
Despite weak equity indices, equity volatility decreased throughout the month, with EURO STOXX 50® and STOXX®600 implied volatility dropping about 1 point and the DAX implied volatility declining even more, nearly 1.5 volatility points
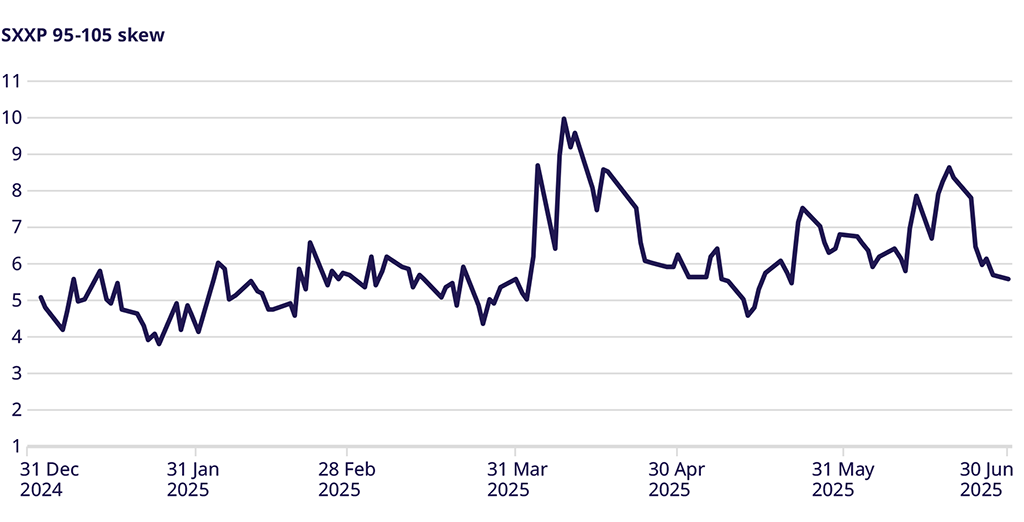
Skew experienced a significant jump in the middle of the month near the options expiry, going as high as 8.66 volatility points, before closing the month closer to the long-term average of 5.5 vol points
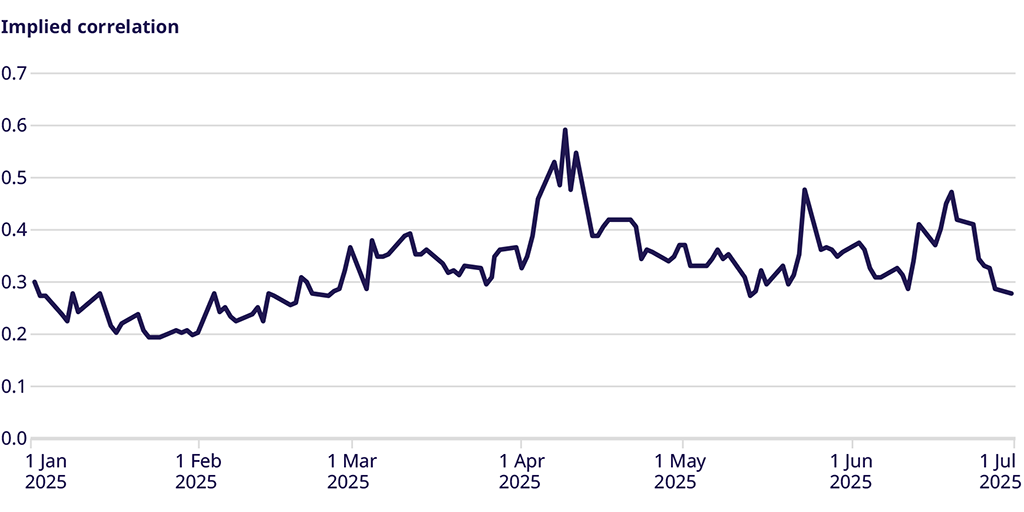
Implied correlation also rose around the options expiry, reaching a high of 47.4% before ending the month lower at 28%.
Equity Index Volatility
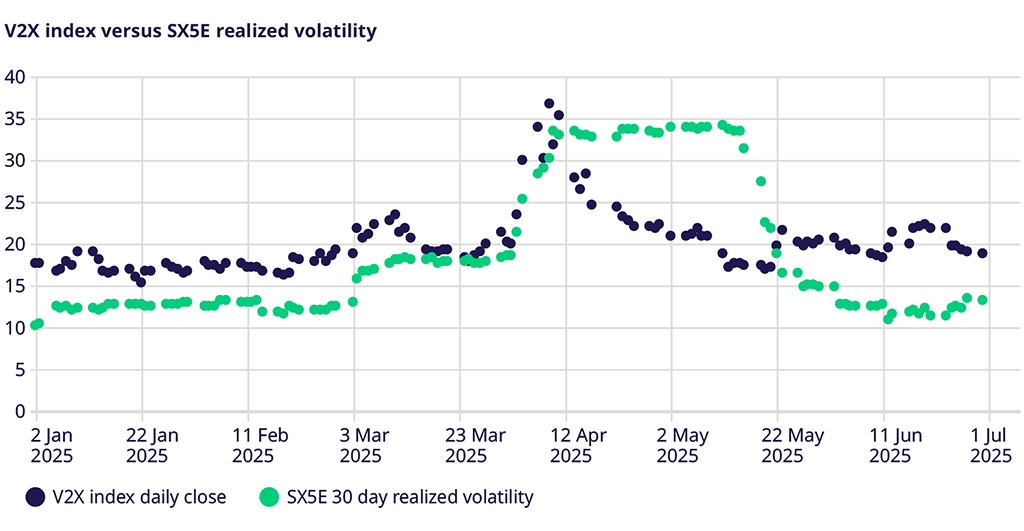
Equity volatility declined throughout the month despite weaker equity markets. However, this doesn’t tell the whole story. In the first two weeks of the month, indices kept pace with the strength of their global peers, then sold off in the third week leading up to the options expiry. This led to a significant increase in implied volatility, but it was not accompanied by a corresponding rise in realized volatility. As a result, implied volatility returned to lower levels by the end of the month, in line with the market's realized volatility.
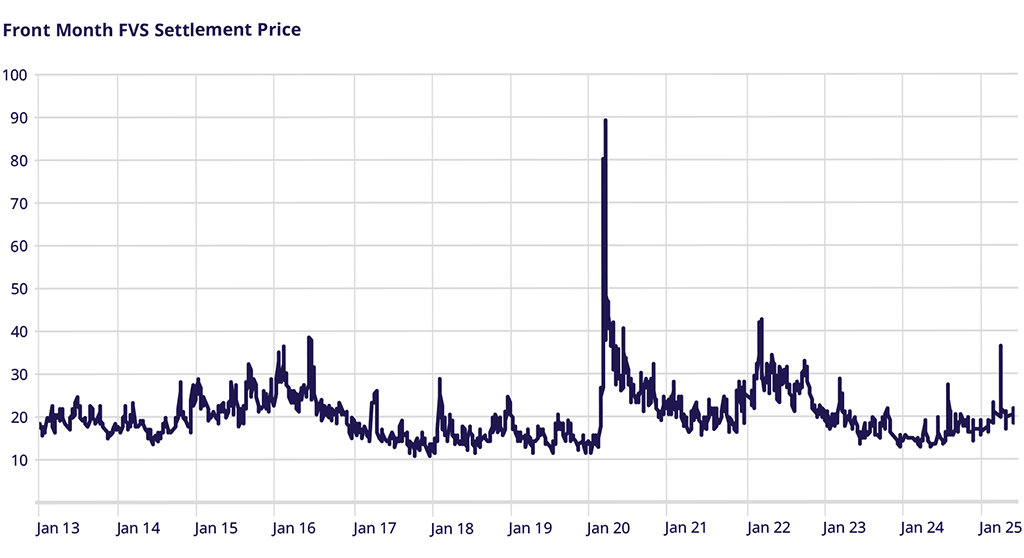
VSTOXX Index performance
Much like the increase seen in equity index implied volatility at expiration, V2X also rose mid-month, climbing from 14.72 at the start of the month to a high of 17.85. As markets recovered by the end of the month, V2X moved lower again and closed at 13.66, nearly a full point below its value at the start of the month.
STOXX Europe 600 Index Skew
Skew began the month at 6.79 vol points, above the longer-term average of about 5.5 vol points. The decline in equity markets along with the rise in implied volatility caused the skew to widen to 8.66 vol points in 95%-105% skew by the options expiration. The market recovery and a reduction in implied volatility led to this same skew narrowing to long-term averages of 5.55 vol points by month-end and quarter-end.
Correlation
Implied correlation showed a move similar to that seen in other options markets. It rose from 36% to 47%, which isn't unusual to see in lower markets. With the market recovering, implied correlation bounced back to over 28% by the end of the month and quarter.
Trade the European volatility benchmark
Explore this year's macro events and find an overview of dates.
VSTOXX 101: Understanding Europe’s Volatility Benchmark
Discover the latest STOXX whitepaper today to learn more about the VSTOXX® core methodology, historical performance analysis, and more.
For more information, please visit the website or contact: